HeavyEdge-Dataset documentation#
HeavyEdge-Dataset is a Python package providing custom PyTorch datasets for loading edge profiles in various ways.
Refer to PyTorch tutorial for information about custom dataset, and HeavyEdge-Landmarks document for details on landmarks.
Note
To run examples in this document, install the package with doc optional dependency:
pip install heavyedge-dataset[doc]
Tutorials#
This section provides basic tutorials for beginners.
Constructing dataset#
Datasets access profile data from hdf5 file, wrapped by heavyedge.ProfileData class.
It is recommended to use the context manager for file handling.
In this tutorial, we use preprocessed data distributed by the heavyedge package.
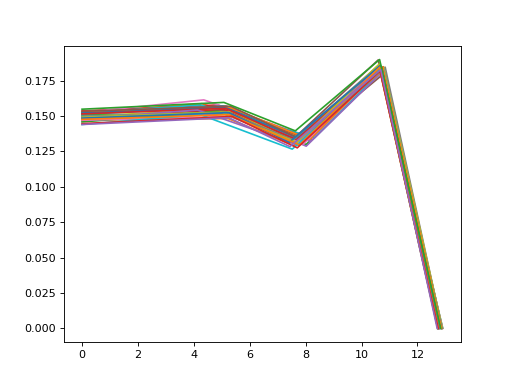
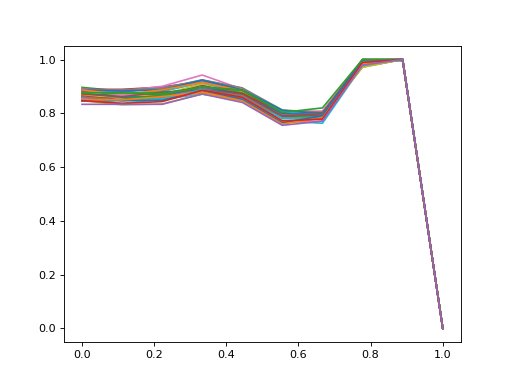
In the example below, we get the entire data using ProfileDataset.
The dataset gives edge profiles and the length of coated regions.
Passing m=1 gets only the y coordinates.
>>> from heavyedge import get_sample_path, ProfileData
>>> from heavyedge_dataset import ProfileDataset
>>> with ProfileData(get_sample_path("Prep-Type3.h5")) as file:
...     profiles, lengths = ProfileDataset(file, m=1)[:]
>>> profiles.shape
(35, 1, 3200)
>>> lengths.shape
(35,)
>>> import matplotlib.pyplot as plt
... plt.plot(*profiles.transpose(1, 2, 0))
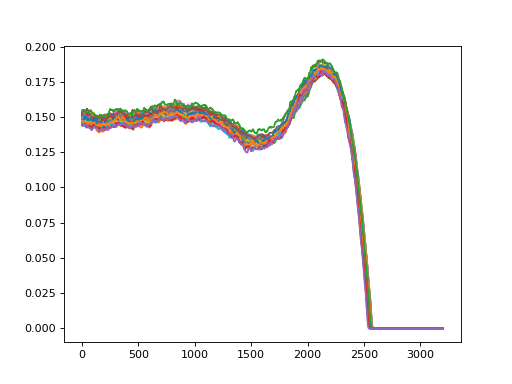
Passing m=2 gets x and y coordinates.
>>> with ProfileData(get_sample_path("Prep-Type3.h5")) as file:
...     profiles, lengths = ProfileDataset(file, m=2)[:]
>>> profiles.shape
(35, 2, 3200)
>>> lengths.shape
(35,)
>>> import matplotlib.pyplot as plt
... plt.plot(*profiles.transpose(1, 2, 0))

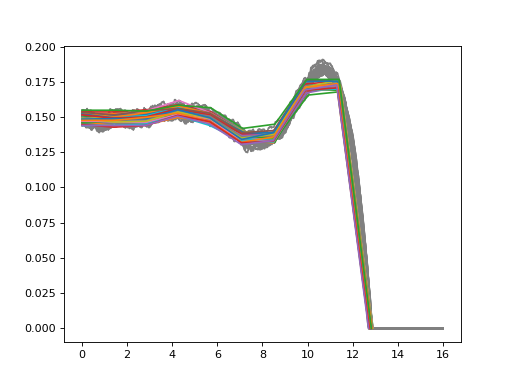
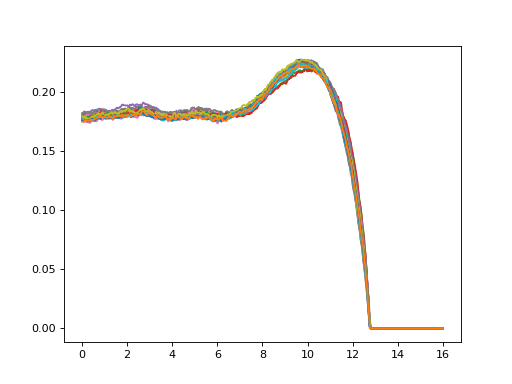
PseudoLandmarkDataset locates pseudo-landmarks from profiles.
Use k parameter to control the number of landmarks to sample.
>>> from heavyedge_dataset import PseudoLandmarkDataset
>>> with ProfileData(get_sample_path("Prep-Type3.h5")) as file:
...     landmarks = PseudoLandmarkDataset(file, m=2, k=10)[:]
>>> landmarks.shape
(35, 2, 10)
>>> import matplotlib.pyplot as plt
... plt.plot(*profiles.transpose(1, 2, 0), color="gray")
... plt.plot(*landmarks.transpose(1, 2, 0))
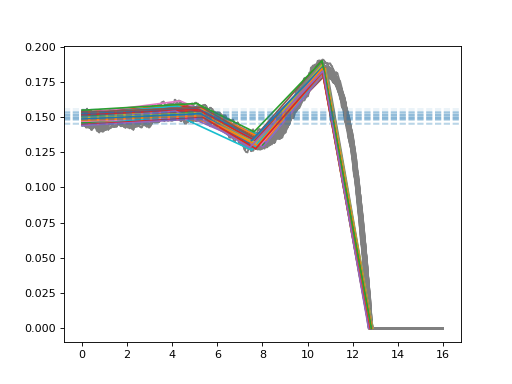
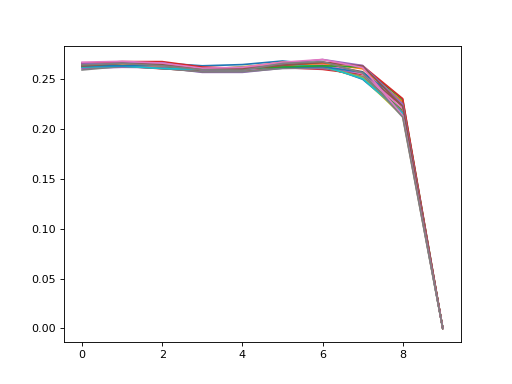
MathematicalLandmarkDataset detects mathematical landmarks and average plateau heights from profiles.
Landmark detection requires sigma parameter for the level of smoothing of profiles.
>>> from heavyedge_dataset import MathematicalLandmarkDataset
>>> with ProfileData(get_sample_path("Prep-Type3.h5")) as file:
...     landmarks, heights = MathematicalLandmarkDataset(file, m=2, sigma=32)[:]
>>> landmarks.shape
(35, 2, 5)
>>> heights.shape
(35,)
>>> import matplotlib.pyplot as plt
... plt.plot(*profiles.transpose(1, 2, 0), color="gray")
... plt.plot(*landmarks.transpose(1, 2, 0))
... for h in heights:
...     plt.axhline(h, ls="--", alpha=0.1)
Data indexing#
In the previous examples, full data were accessed by slicing. Indices and steps can also be specified.
>>> from heavyedge import get_sample_path, ProfileData
>>> from heavyedge_dataset import ProfileDataset
>>> with ProfileData(get_sample_path("Prep-Type3.h5")) as file:
...     profiles, lengths = ProfileDataset(file, m=2)[2:9:3]
>>> profiles.shape
(3, 2, 3200)
You can also use list indexing in any arbitrary order.
>>> with ProfileData(get_sample_path("Prep-Type3.h5")) as file:
...     profiles, lengths = ProfileDataset(file, m=2)[[2, 1, 0]]
>>> profiles.shape
(3, 2, 3200)
When a single index is specified, the result is squeezed.
>>> with ProfileData(get_sample_path("Prep-Type3.h5")) as file:
...     profile, length = ProfileDataset(file, m=2)[0]
>>> profile.shape
(2, 3200)
>>> length.shape
()
Data transformation#
Pass a callable to transform parameter to modify the data.
In this example, heavyedge_landmarks.minmax() is used for within-sample minmax scaling of each profile.
>>> from heavyedge_landmarks import minmax
>>> with ProfileData(get_sample_path("Prep-Type3.h5")) as file:
...     landmarks = PseudoLandmarkDataset(file, m=2, k=10, transform=minmax)[:]
>>> import matplotlib.pyplot as plt
... plt.plot(*landmarks.transpose(1, 2, 0))
Data loading#
You can use torch.utils.data.DataLoader for batched loading.
Note that because the default collate_fn transforms the loaded data to torch.Tensor, datasets which return tuple require collate_fn parameter to be set.
>>> import torch
>>> from torch.utils.data import DataLoader
>>> with ProfileData(get_sample_path("Prep-Type3.h5")) as file:
...     dataset = ProfileDataset(file, m=2)
...     loader = DataLoader(dataset, batch_size=5, collate_fn=lambda x: tuple(map(torch.from_numpy, x)))
...     profiles, lengths = next(iter(loader))
>>> profiles.shape
torch.Size([5, 2, 3200])
>>> lengths.shape
torch.Size([5])
Module API#
Profile data#
Loads full profile data.
- class heavyedge_dataset.ProfileDataset(file, m=1, transform=None)[source]#
Edge profile dataset.
Loads data as a tuple of two numpy arrays:
Profile data, shape: (N, m, L).
Length of each profile, shape: (N,).
N is the number of loaded data, m is dimension of coordinates, and L is the maximum length of profiles.
- Parameters:
- fileheavyedge.ProfileData
Open hdf5 file.
- m{1, 2}
Profile data dimension. 1 means only y coordinates, and 2 means both x and y coordinates.
- transformcallable, optional
Optional transformation to be applied on samples.
Examples
>>> from heavyedge import get_sample_path, ProfileData
>>> from heavyedge_dataset import ProfileDataset
>>> with ProfileData(get_sample_path("Prep-Type2.h5")) as file:
...     profiles, lengths = ProfileDataset(file, m=1)[:]
>>> profiles.shape
(22, 1, 3200)
>>> with ProfileData(get_sample_path("Prep-Type2.h5")) as file:
...     profiles, lengths = ProfileDataset(file, m=2)[:]
>>> profiles.shape
(22, 2, 3200)
>>> lengths.shape
(22,)
>>> import matplotlib.pyplot as plt
... plt.plot(*profiles.transpose(1, 2, 0))
Landmark data#
Loads landmark data representing profiles.
- class heavyedge_dataset.PseudoLandmarkDataset(file, m, k, transform=None)[source]#
Dataset for pseudo-landmarks of edge profiles
- Parameters:
- fileheavyedge.ProfileData
Open hdf5 file.
- m{1, 2}
Dimension of landmark coordinates.
- kint
Number of landmarks to sample.
- transformcallable, optional
Optional transformation to be applied on samples.
Examples
>>> from heavyedge import ProfileData, get_sample_path
>>> from heavyedge_dataset import PseudoLandmarkDataset
>>> with ProfileData(get_sample_path("Prep-Type1.h5")) as file:
...     dataset = PseudoLandmarkDataset(file, 1, 10)
...     data = dataset[:]
>>> data.shape
(18, 1, 10)
>>> import matplotlib.pyplot as plt
... plt.plot(*data.transpose(1, 2, 0))
- class heavyedge_dataset.MathematicalLandmarkDataset(file, m, sigma, ptype=3, transform=None)[source]#
Dataset for mathematical landmarks of edge profiles.
Loads data as a tuple of two numpy arrays:
Landmark coordinates, shape: (N, m, k).
Average plateau height, shape: (N,).
N is the number of loaded data, m is dimension of coordinates, and k is the number of mathematical landmarks detected; k=5 for type 3 profiles and k=4 for type 1 and type 2 profiles.
- Parameters:
- fileheavyedge.ProfileData
Open hdf5 file.
- m{1, 2}
Dimension of landmark coordinates.
- sigmascalar
Standard deviation of Gaussian kernel for landmark detection.
- ptype{1, 2, 3}, default=3
Assumed type of edge profiles.
- transformcallable, optional
Optional transformation to be applied on samples.
Notes
Unlike HeavyEdge-Landmarks package, landmark points returned by this dataset are sorted by ascending X coordinates. Additionally, the point at X=0 is included as the first landmark.
Examples
>>> from heavyedge import ProfileData, get_sample_path
>>> from heavyedge_dataset import MathematicalLandmarkDataset
>>> with ProfileData(get_sample_path("Prep-Type3.h5")) as file:
...     dataset = MathematicalLandmarkDataset(file, 1, 32)
...     landmarks, height = dataset[:]
>>> landmarks.shape
(35, 1, 5)
>>> height.shape
(35,)
>>> with ProfileData(get_sample_path("Prep-Type3.h5")) as file:
...     dataset = MathematicalLandmarkDataset(file, 2, 32)
...     landmarks, height = dataset[:]
>>> landmarks.shape
(35, 2, 5)
>>> import matplotlib.pyplot as plt
... plt.plot(*landmarks.transpose(1, 2, 0))